Examples
%matplotlib inline
from __future__ import print_function
import pandas as pd
try:
    import seaborn
except:
    pass
from climate_index import database, print_database, plot_climate_index
Print the climate index database
print_database()
AMO
Atlantic multidecadal oscillation SST Index
http://www.esrl.noaa.gov/psd/gcos_wgsp/Timeseries/Data/amo.long.data
AMO_DETREND
Atlantic multidecadal oscillation SST Index (detrended)
http://www.esrl.noaa.gov/psd/data/correlation//amon.us.long.data
AMO_DETREND_SM
Atlantic multidecadal oscillation SST Index (detrended, smoothed)
http://www.esrl.noaa.gov/psd/data/correlation/amon.sm.long.data
AMO_SM
Atlantic multidecadal oscillation SST Index (smoothed)
http://www.esrl.noaa.gov/psd/gcos_wgsp/Timeseries/Data/amo.sm.long.data
AO
Arctic Oscillation Index
http://www.esrl.noaa.gov/psd/gcos_wgsp/Timeseries/Data/ao.long.data
AO20R
Arctic Oscillation Index from the 20thC Reanalysis
http://www.esrl.noaa.gov/psd/gcos_wgsp/Timeseries/Data/ao20thc.long.data
AP
Ponta Delgada, Azores SLP
http://www.esrl.noaa.gov/psd/gcos_wgsp/Timeseries/Data/nao_azo.long.data
GLOBAL_T_CRU
Global Average Temperature Anomaly (CRU)
http://www.esrl.noaa.gov/psd/gcos_wgsp/Timeseries/Data/taveglhc4.long.data
GLOBAL_T_SST
Global Average Temperature & SST Anomalies (Station + SST)
http://www.esrl.noaa.gov/psd/gcos_wgsp/Timeseries/Data/GLBTSSST.long.data
GLOBAL_T_STATION
Global Average Temperature Anomalies (Station Only)
http://www.esrl.noaa.gov/psd/gcos_wgsp/Timeseries/Data/GLBTS.long.data
GP
Gibraltar SLP
http://www.esrl.noaa.gov/psd/gcos_wgsp/Timeseries/Data/nao_gib.long.data
IP
Iceland SLP
http://www.esrl.noaa.gov/psd/gcos_wgsp/Timeseries/Data/nao_ice.long.data
MP
Madras SLP
http://www.esrl.noaa.gov/psd/gcos_wgsp/Timeseries/Data/madrasslp.long.data
NAO
North Atlantic Oscillation
http://www.esrl.noaa.gov/psd/gcos_wgsp/Timeseries/Data/nao.long.data
NINO12
Nino 1+2 SST Index
http://www.esrl.noaa.gov/psd/gcos_wgsp/Timeseries/Data/nino12.long.anom.data
NINO3
Nino 3 SST Index
http://www.esrl.noaa.gov/psd/gcos_wgsp/Timeseries/Data/nino3.long.anom.data
NINO34
Nino 3.4 SST Index
http://www.esrl.noaa.gov/psd/gcos_wgsp/Timeseries/Data/nino34.long.anom.data
NINO4
Nino 4 SST Index
http://www.esrl.noaa.gov/psd/gcos_wgsp/Timeseries/Data/nino4.long.anom.data
NP
North Pacific Index
http://www.esrl.noaa.gov/psd/gcos_wgsp/Timeseries/Data/np.long.data
NSLP
Nagasaki SLP
http://www.esrl.noaa.gov/psd/gcos_wgsp/Timeseries/Data/nagasakipres.long.data
PDO
Pacific Decadal Oscillation
http://www.esrl.noaa.gov/psd/gcos_wgsp/Timeseries/Data/pdo.long.data
RNAO
Reconstructed monthly NAO index back to December 1658
http://www.esrl.noaa.gov/psd/gcos_wgsp/Timeseries/Data/rnao.long.data
SOI
Southern Oscillation Index
http://www.esrl.noaa.gov/psd/gcos_wgsp/Timeseries/Data/soi.long.data
SUNSPOT
Sunspot Index
http://www.esrl.noaa.gov/psd/gcos_wgsp/Timeseries/Data/sunspot.long.data
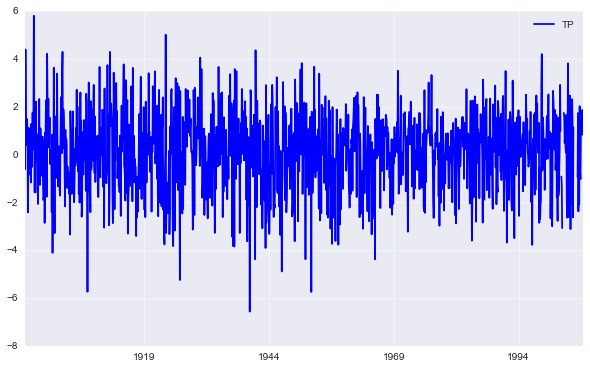
TP
Trans Polar Index
http://www.esrl.noaa.gov/psd/gcos_wgsp/Timeseries/Data/tpi.long.data
Show each climate index
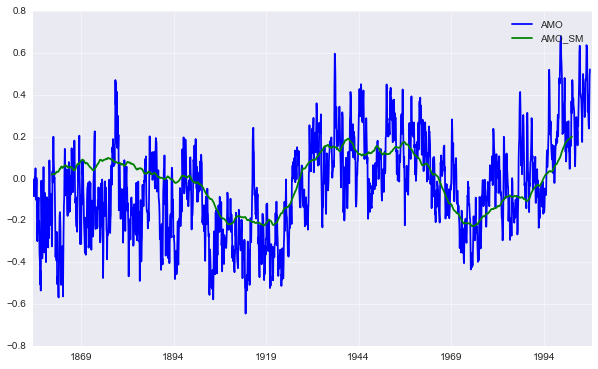
print(database['amo']['long_name'])
print(database['amo_sm']['long_name'])
plot_climate_index('amo')
plot_climate_index('amo_sm')
Atlantic multidecadal oscillation SST Index
Atlantic multidecadal oscillation SST Index (smoothed)
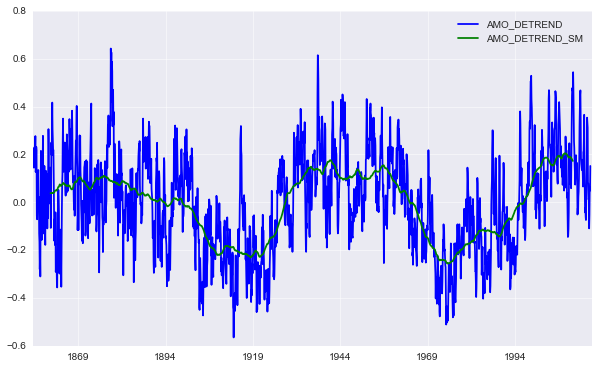
print(database['amo_detrend']['long_name'])
print(database['amo_detrend_sm']['long_name'])
plot_climate_index('amo_detrend')
plot_climate_index('amo_detrend_sm')
Atlantic multidecadal oscillation SST Index (detrended)
Atlantic multidecadal oscillation SST Index (detrended, smoothed)
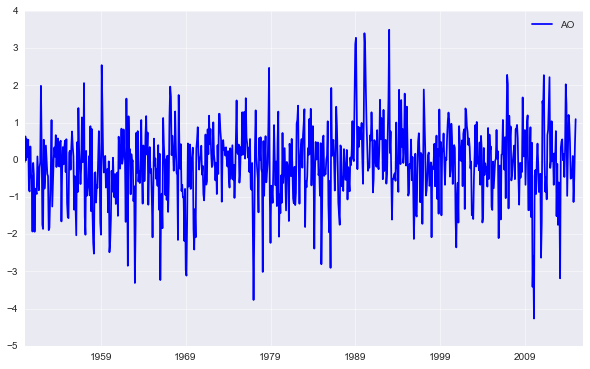
print(database['ao']['long_name'])
plot_climate_index('ao')
Arctic Oscillation Index
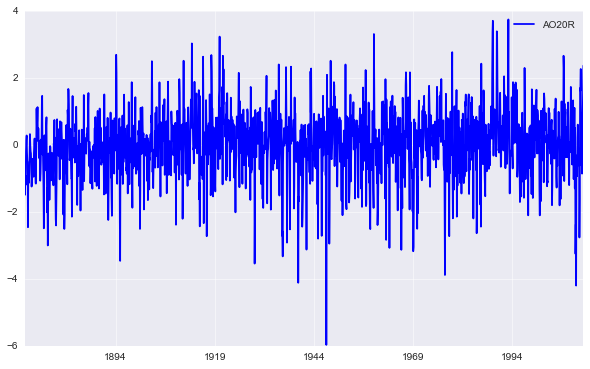
print(database['ao20r']['long_name'])
plot_climate_index('ao20r')
Arctic Oscillation Index from the 20thC Reanalysis
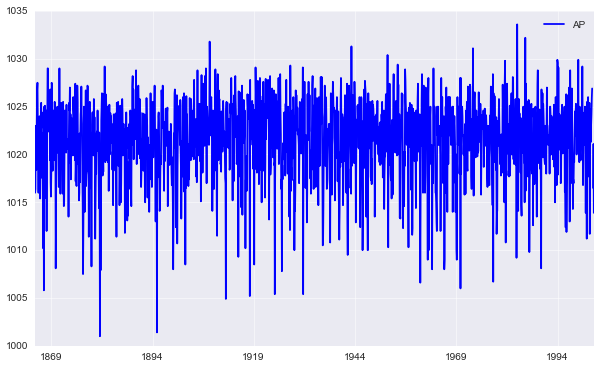
print(database['ap']['long_name'])
plot_climate_index('ap')
Ponta Delgada, Azores SLP
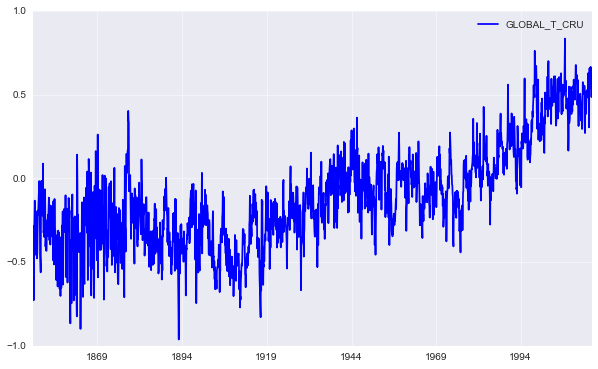
print(database['global_t_cru']['long_name'])
plot_climate_index('global_t_cru')
Global Average Temperature Anomaly (CRU)
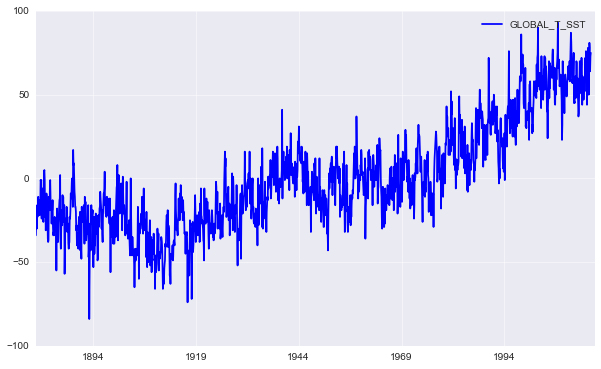
print(database['global_t_sst']['long_name'])
plot_climate_index('global_t_sst')
Global Average Temperature & SST Anomalies (Station + SST)
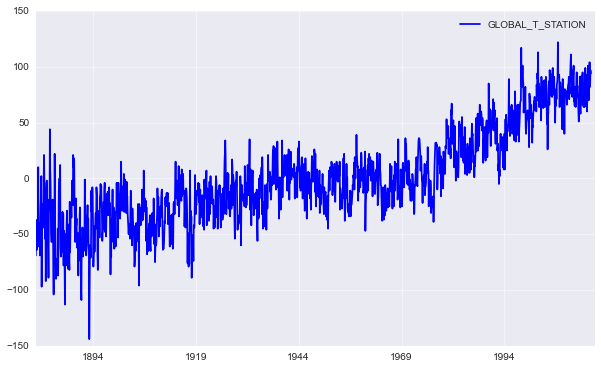
print(database['global_t_station']['long_name'])
plot_climate_index('global_t_station')
Global Average Temperature Anomalies (Station Only)
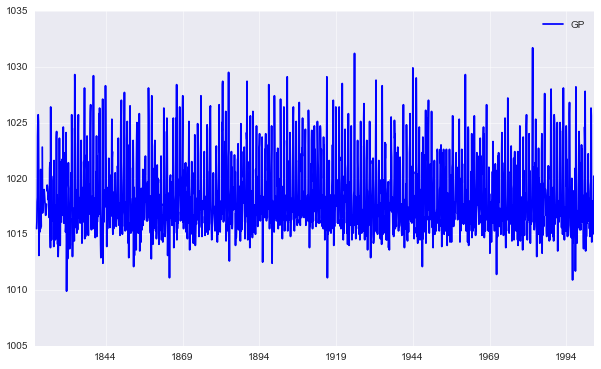
print(database['gp']['long_name'])
plot_climate_index('gp')
Gibraltar SLP
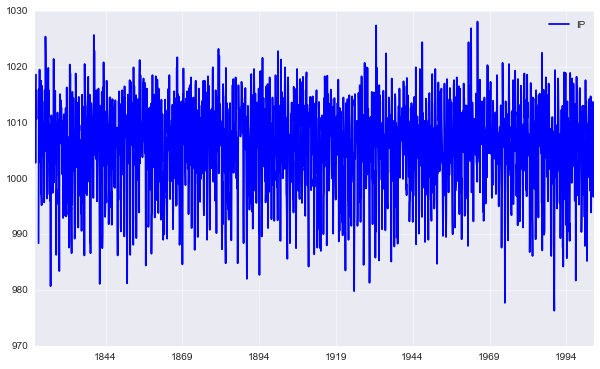
print(database['ip']['long_name'])
plot_climate_index('ip')
Iceland SLP
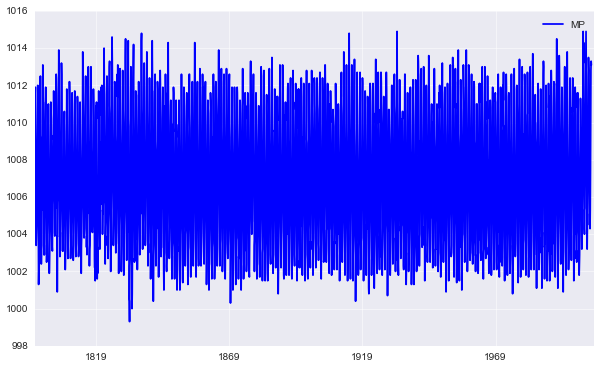
print(database['mp']['long_name'])
plot_climate_index('mp')
Madras SLP
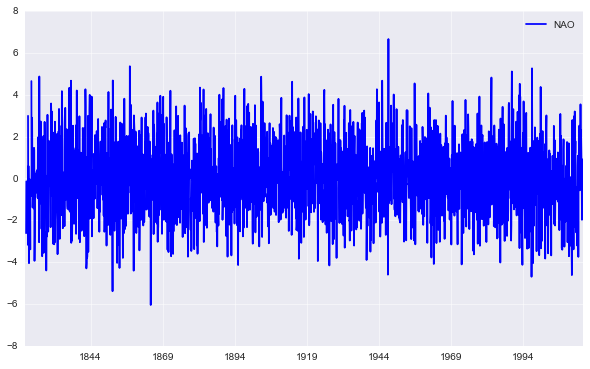
print(database['nao']['long_name'])
plot_climate_index('nao')
North Atlantic Oscillation
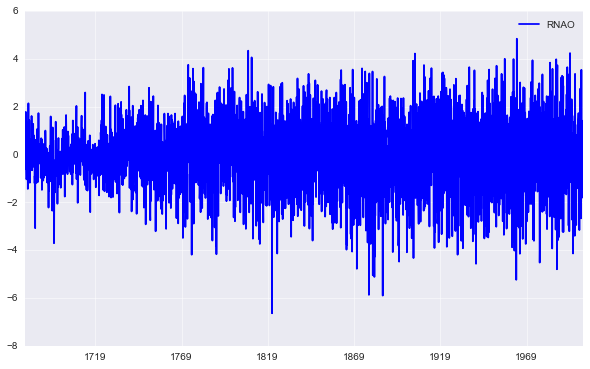
print(database['rnao']['long_name'])
plot_climate_index('rnao')
Reconstructed monthly NAO index back to December 1658
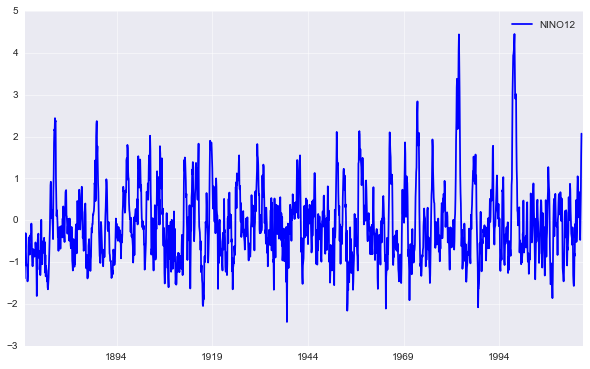
print(database['nino12']['long_name'])
plot_climate_index('nino12')
Nino 1+2 SST Index
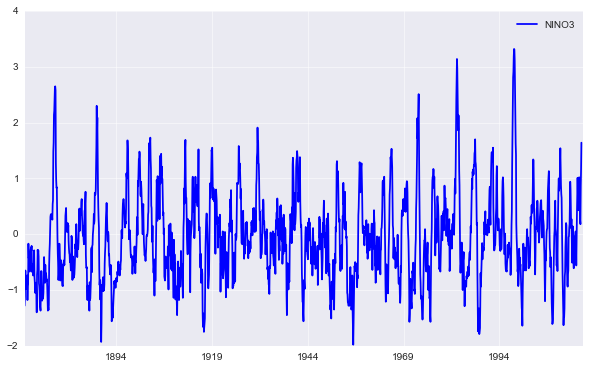
print(database['nino3']['long_name'])
plot_climate_index('nino3')
Nino 3 SST Index
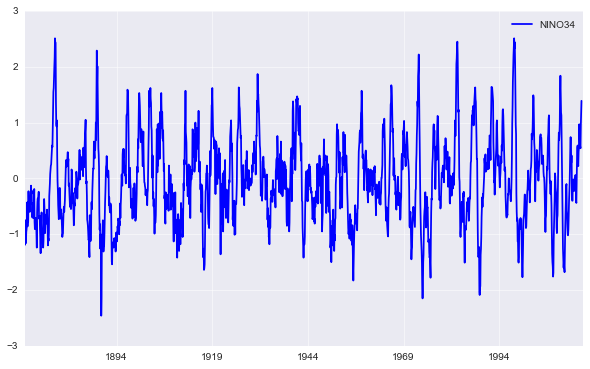
print(database['nino34']['long_name'])
plot_climate_index('nino34')
Nino 3.4 SST Index
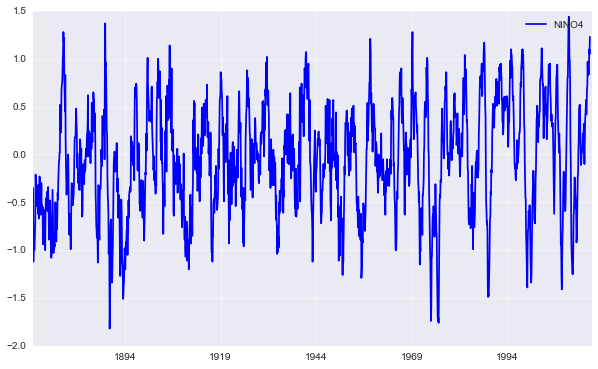
print(database['nino4']['long_name'])
plot_climate_index('nino4')
Nino 4 SST Index
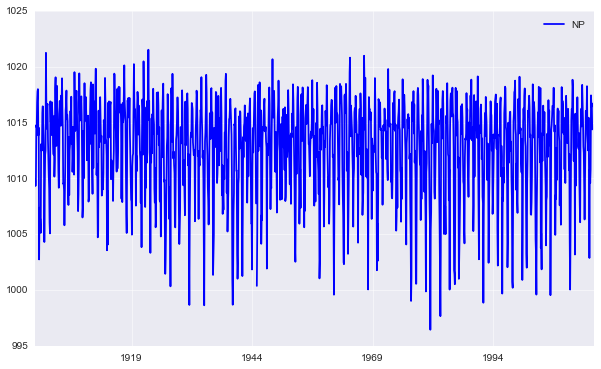
print(database['np']['long_name'])
plot_climate_index('np')
North Pacific Index
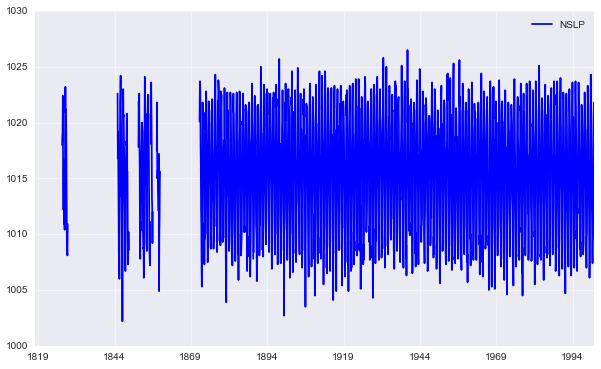
print(database['nslp']['long_name'])
plot_climate_index('nslp')
Nagasaki SLP
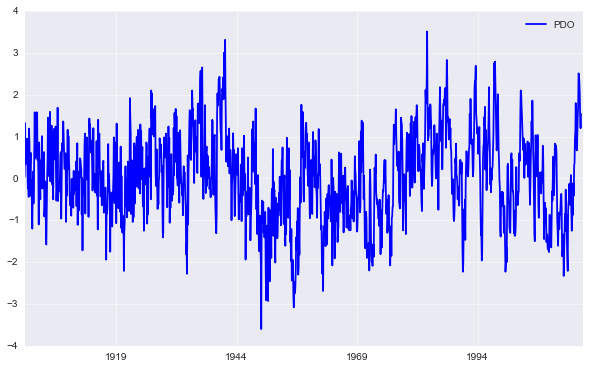
print(database['pdo']['long_name'])
plot_climate_index('pdo')
Pacific Decadal Oscillation
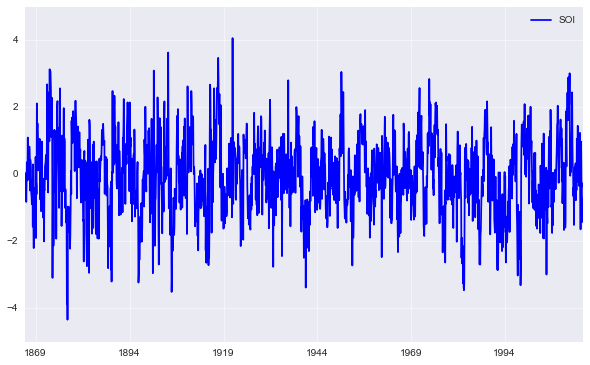
print(database['soi']['long_name'])
plot_climate_index('soi')
Southern Oscillation Index
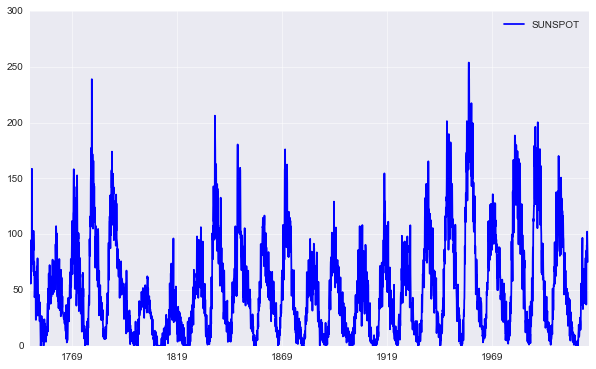
print(database['sunspot']['long_name'])
plot_climate_index('sunspot')
Sunspot Index
print(database['tp']['long_name'])
plot_climate_index('tp')
Trans Polar Index